Analytics
See what's working, find the gaps — then just ask
Every conversation leaves a trail. We turn it into a dashboard you can read at a glance, drill into per agent and per channel, and follow over time — so you can double down on what's working and fix what isn't. And when you'd rather not read charts, just ask Saba in plain language.
Ask your analytics anything
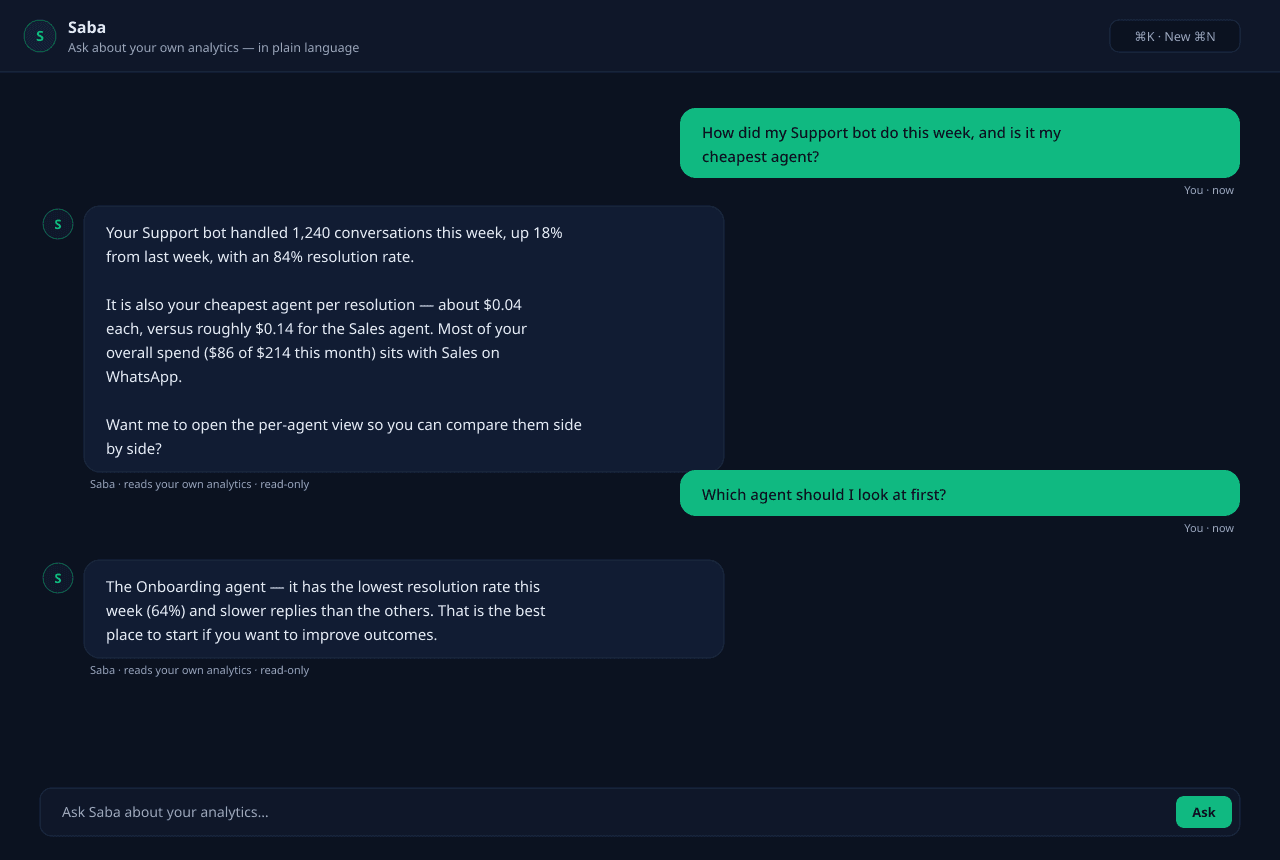
Just ask — Saba reads your own numbers
Instead of hunting through charts, ask in plain language. Saba reads your organization's own analytics and answers — when you ask, never on its own.
Saba · analytics
Ask Saba about your own numbers
Ask Saba about your own numbers
What the analytics suite shows you
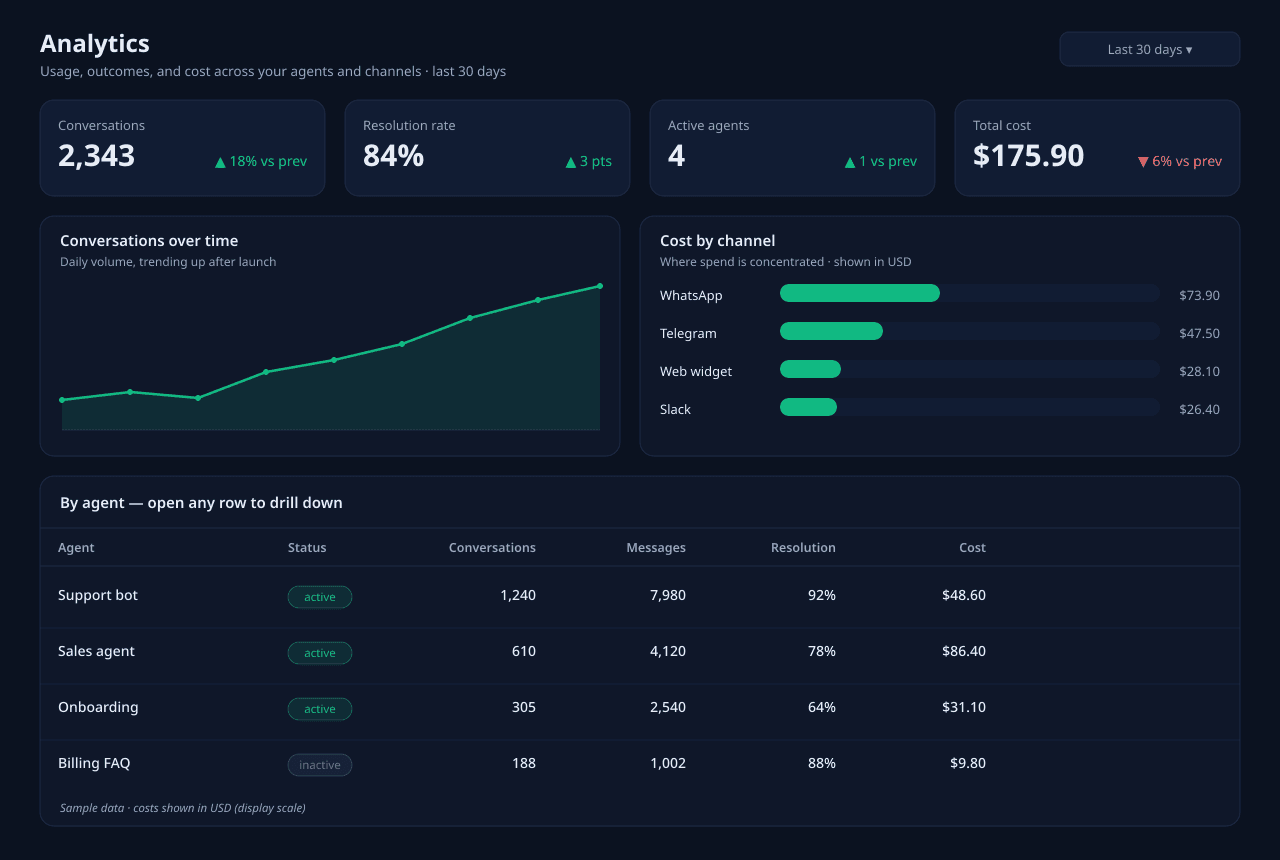
A dashboard that reads at a glance
Conversation volume, resolution rate, active agents, and total cost sit on one overview — with the trend against the previous period so you see direction, not just a number frozen in time.
Drill down per agent
Open any agent to see its own conversation count, message volume, resolution rate, and spend. Compare your Support bot against Sales and spot the one that's quietly underperforming.
Drill down per channel
Telegram, WhatsApp, Slack, the web widget, and the rest each get their own breakdown — so you know where your traffic actually comes from and where the cost is concentrated.
Trends over time
Every metric plots as a time series. Watch volume climb after a launch, catch a latency regression the day it starts, and see whether a prompt change moved resolution up or down.
Cost and LLM spend, tracked to the request
Every model call is priced and rolled up, so usage and credit burn are never a surprise. See spend per agent, per channel, and per day — and know exactly what's driving the bill.
Ask Saba what moved and why
Skip the chart-staring. Ask in plain language — "which agents are winning this week?" — and Saba reads your own analytics and explains the shift, the same answer it gives inside the panel.
From conversation to insight
Analytics is automatic — every conversation is measured and priced as it happens, then aggregated so the dashboards, drill-downs, and Saba's answers all read from the same numbers.
Every conversation is measured
As agents talk, message counts, resolution outcomes, and latency are captured automatically — no instrumentation to set up, no events to wire.
Every model call is priced
Each LLM request is costed against current model pricing and attributed to the right agent and channel, so spend rolls up alongside usage.
Metrics are aggregated
Raw activity is rolled up by agent, by channel, and by day, and scoped to your organization — so the numbers stay yours and stay fast to query.
Dashboards and drill-downs render
The overview, per-agent, per-channel, and time-series views all read from the same aggregates, so what you see lines up no matter where you look.
Saba explains it in words
Ask a question and Saba queries the same analytics to summarize what changed and why — turning the dashboard into a plain-language answer.
Where the numbers earn their keep
Built for teams who run on what the data says
Spot the underperforming agent
Compare your agents side by side and find the one that's quietly falling behind — lower resolution, slower replies — before it costs you customers.
Find your coverage gaps
Use the dashboard and Ask Saba together to see where the agent falls short — the questions it handles poorly — so you know exactly what to add to its knowledge or prompt next.
Control and forecast LLM spend
See spend per agent, per channel, and per day in plain currency, so you can catch what's driving the bill and plan ahead instead of being surprised.
Prove channel ROI
See which channels carry your volume and what each one costs, so you can invest in the ones that pay off and rethink the ones that don't.